EDIT: To view charts don't use incognito mode and also don't use mobile devices. Sorry!! You can direct access the reports here
On Tuesday morning while drinking my warm tulsi tea and reading stories and browsing on @hashnode a thought came while watching my blog analytics dashboard that I have less engagement and reactions and I am desperate about the #HashnodeGiveaway challenge 😂 don't know why? Maybe because I am first time blogging. So below is my 16hrs of time invested into answering some questions that can increase user engagement on twitter and could lead them to the Hashnode platform increasing the reactions on stories.
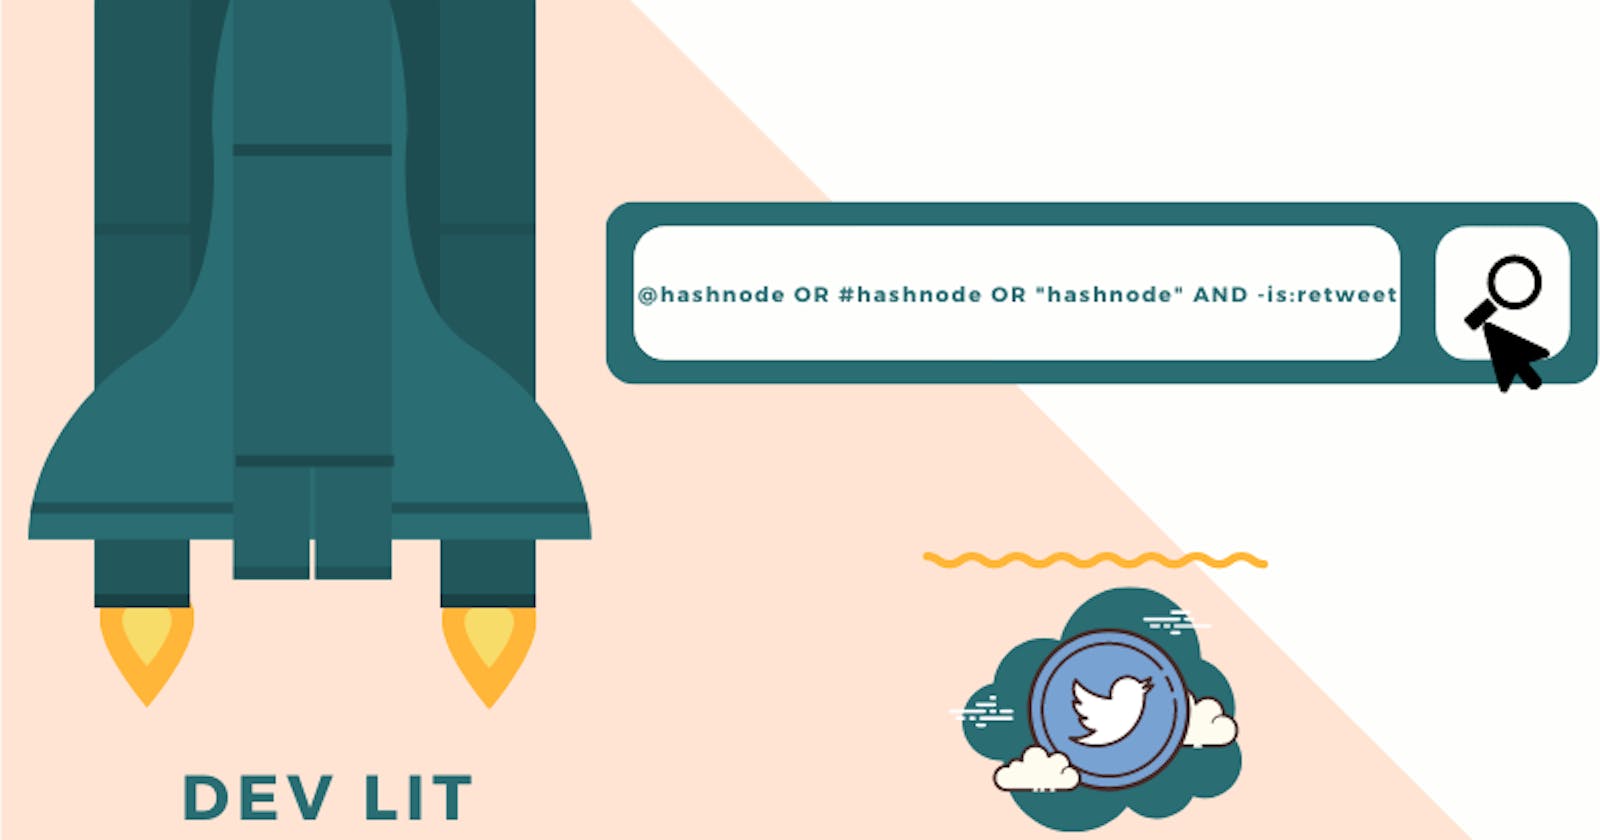
The source of these answers is from twitter - I scraped tweets since UTC 2020-06-23 18:30:18 until UTC 2020-08-19 18:08:57 based on query = "hashnode" OR @hashnode OR #hashnode AND -is:retweet referring this twitter doc that gave me ~4K tweets. So let us start by answering some questions. The charts below are interactive you can search, pick a date range, and sort the data by hovering over the charts and clicking the sort button on the top right corner. All set so let's start!!
How is the platform performing since the beta launch?
User Engagement?
Identifying when to tweet about our blog or stories by knowing when users are most active.
Note: Time is in UTC format.
Seems like tweets will get more engagement when posted on Friday around 13:00.
But what type of stories to write? Hmmm....... 🤔
Let us see, how hashtags are performing?
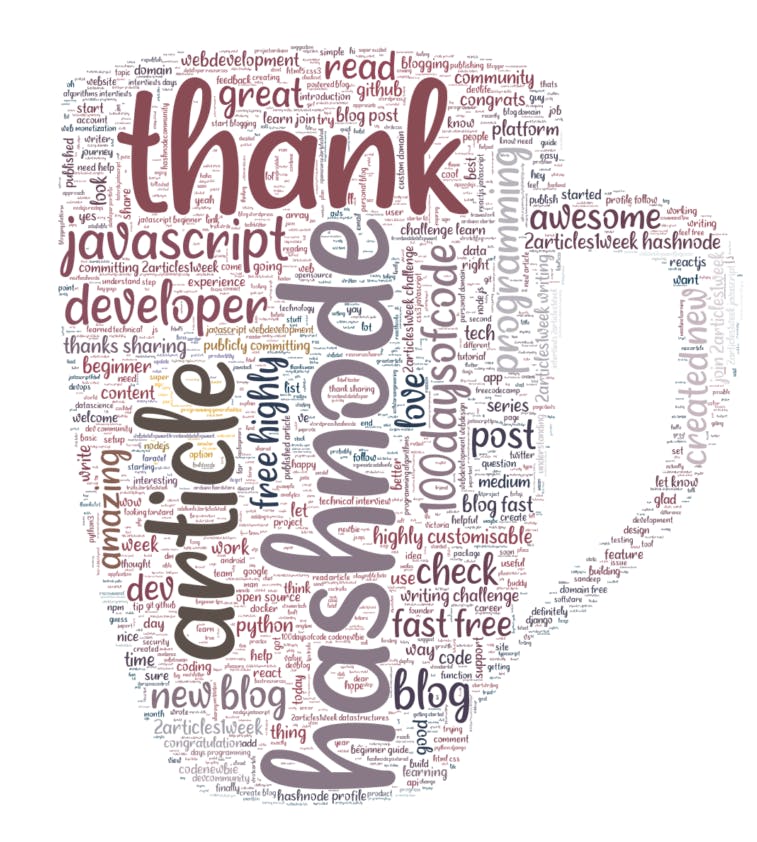
We will get a brief idea of content that mostly engage users over twitter.
JavaScript content is getting more engagement based on the number of retweets and If you have used the sorted function in the above charts you will notice that content like metaprogramming, Julia, remote-sensing, cloud, and docker is getting attractions as well. And, also users are really supporting and motivating the 2articles1week challenge.
But only hashtags don't give the correct picture. So I extracted stories URL's that were mentioned in the tweets.

I extracted keywords that are in the title of stories - from the URL path and blend it with the user engagement metrics by tweet-id. Below you can play with the charts, and know which keywords in the title engage users more and what is trending as well.
JavaScript is again winner. Most liked, retweeted, and replied stories are beginners guide, introduction-to-something, learn, understand something, a tutorial, web development, etc.
As I wanted my next story related to python. Using this text corpus of tweets, hashtags, and keywords from the title. I build a Word2Vec model that answers what my next python story should have?
- I started by first loading the tweets and cleaning it by removing emojis, URLs, @mentions, and stop-words.
- Secondly, building the word2vec model. To know more about Word2Vec visit here
- Lastly, finding some analogies and similarities between words.
- Now finding analogy and similarity. The word embedding approach is also able to capture multiple different degrees of similarity between words. Semantic patterns can be reproduced using vector arithmetics. Thus, we could also use word2vec to solve analogies. For example, If India has cricket, what does the US have? You can play with such analogies and similarities with a pre-trained model online here
Okay, my next article will be definitely based on data science or building rest API with python.
Hope you like this story. I am thinking of refreshing those charts on a weekly basis if you want the same please do provide your feedback in the comments below and subscribe to the newsletter for updates. Meanwhile, I'll have my warm tulsi tea. Thank you.


